
A huge first bundle
Every route, chart library and icon set ships on the first load, because nothing is split by route or loaded on demand.
Service·Vue 3·Nuxt·Measured before and after
Slow pages lose visitors, and slow dashboards waste your customers' day. Our senior engineers measure where your Vue or Nuxt app spends its time, fix the biggest causes first and show you the numbers before and after each change.
 Core Web VitalsLCP · INP · CLS
 Bundle analysis
 Hydration
 Nuxt SSR
 Virtual scrolling
 Vite
When teams call us
Every route, chart library and icon set ships on the first load, because nothing is split by route or loaded on demand.
A click or keystroke waits behind long JavaScript tasks, often a large reactive update or a list that re-renders in full. That is what a poor INP score looks like.
Thousands of rows render at once, each one reactive. Scrolling stutters, and memory climbs the longer the tab stays open.
A Nuxt page renders on the server, then the browser hydrates every component, including ones far below the fold. Mismatches add extra work and console warnings.
Big API responses wrapped in ref() make Vue track every nested field, even data the screen only reads once.
The app waits for the API before it shows anything, however fast the API is. Nothing is cached between visits or between routes.
How we work
We pick the pages and interactions that matter to your business and record a baseline: Core Web Vitals, bundle size and the timings your users notice.
We profile the app and trace each slow moment to a cause, such as a chunk that loads too early, a list that re-renders in full or a hydration mismatch.
Each fix is its own pull request: route-level code splitting, defineAsyncComponent, shallowRef for large read-only data, v-memo on heavy lists or virtual scrolling.
After each change we re-run the same measurements, so you can see which fixes moved the numbers and which didn't.
Speed tends to slip one feature at a time. We hand over budgets and the checks that guard them, so the next release doesn't undo the work.
Deliverables
Core Web Vitals, bundle sizes and key timings before and after, measured the same way each time.
What makes the app slow, ordered by impact and effort, with the evidence behind each one.
Reviewable fixes in your repository, one cause per PR, so each can be checked and rolled back on its own.
What ships on each route and why, and what we moved out of the first load.
For Nuxt apps: which pages render on the server, which are cached with Nitro route rules and which hydrate lazily.
Limits for bundle size and key metrics, plus the checks that warn when a change goes over them.
Engagement and price
Monthly billing at a flat rate. No onboarding fees, no minimum commitment, and you can pause or cancel anytime. Our hours overlap with US and EU time zones.
Performance work next to your team: we find the causes and ship the fixes while your developers stay on features.
A senior engineer focused on speed until the targets are met, then on keeping new features within budget.
For large products where performance work spans several apps or teams and needs shared standards.
A performance audit on its own: the baseline, the ranked causes and a fix plan your team carries out.
Relevant work
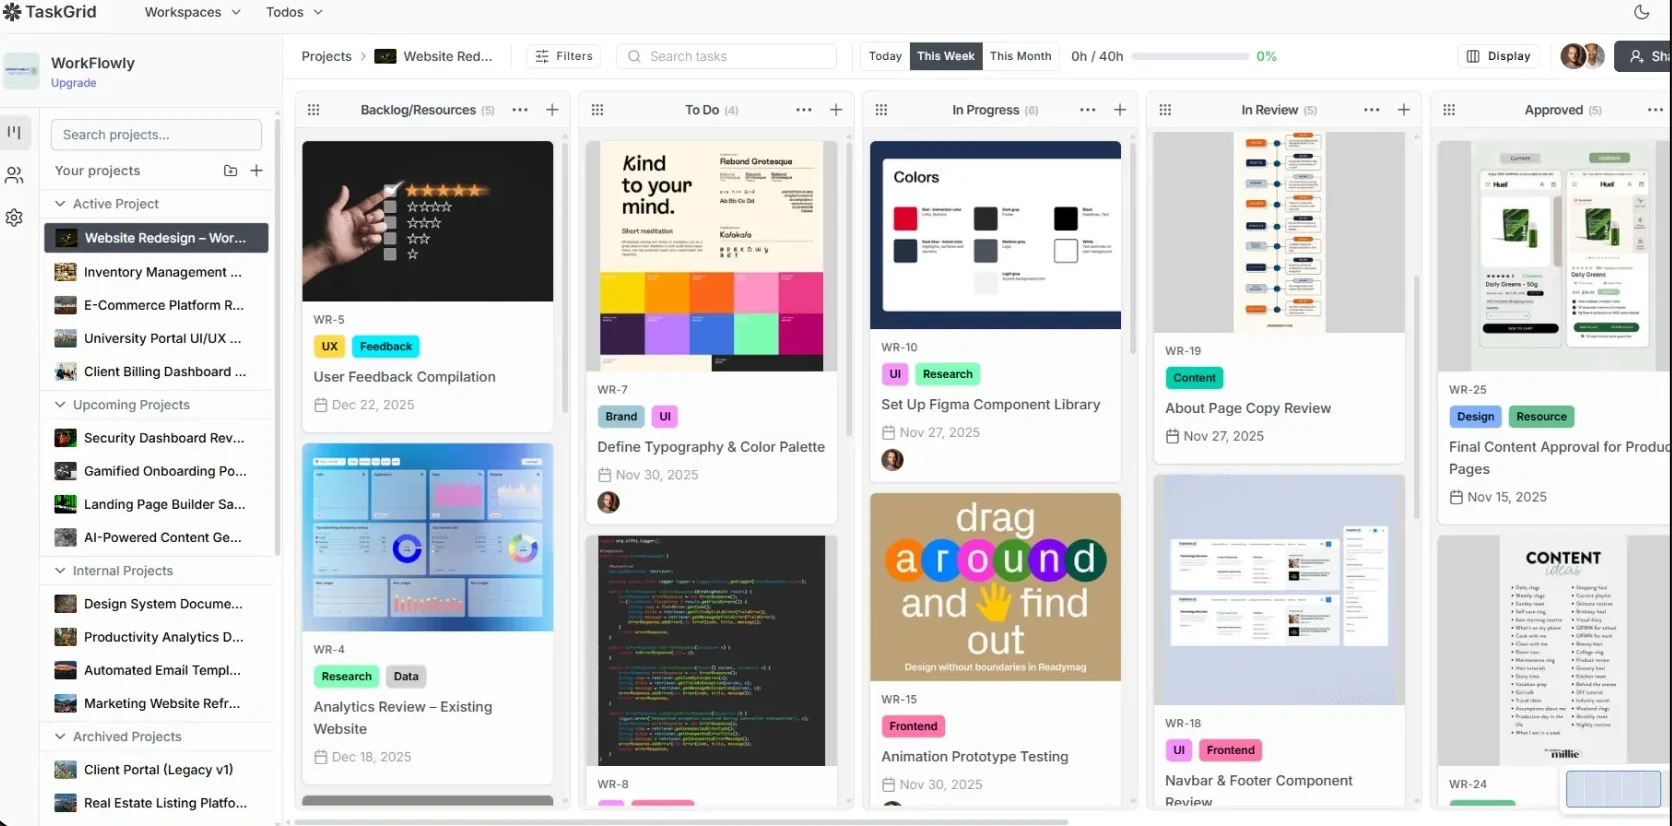
A custom drag-and-drop engine that keeps working on virtualized columns, and boards that load instantly from IndexedDB before refreshing from the API.
Read the case study
We measured inlined CSS per page and switched it off, whitelisted PrimeVue components and split vendor code into chunks. Search filters on real teacher availability without one query per teacher.
Read the case study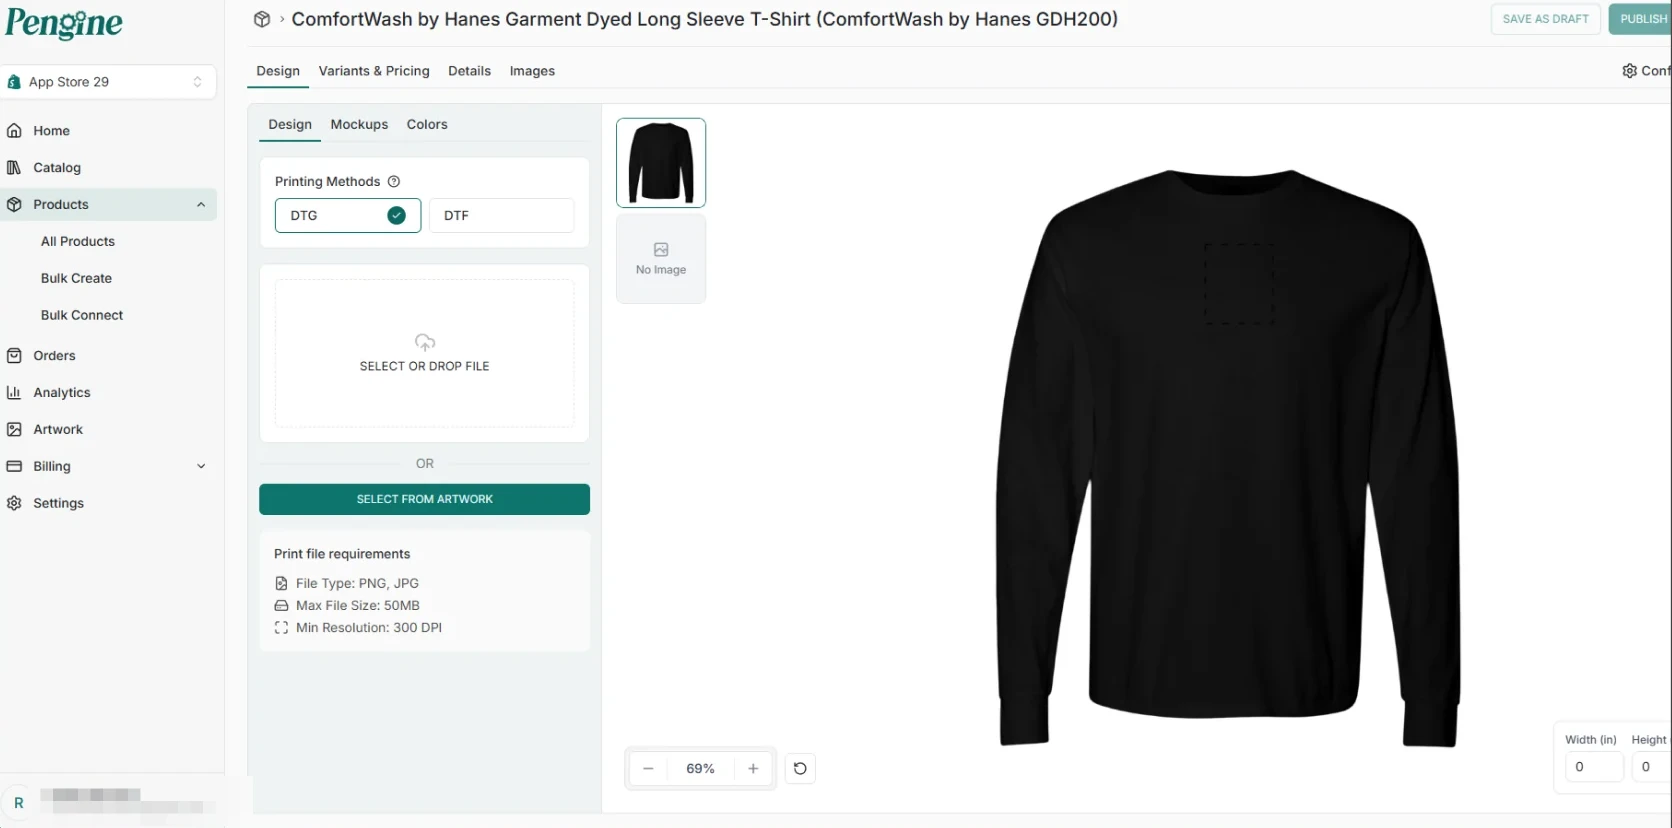
Sellers preview their design on every garment color they pick, rendered in the browser instead of a server round trip per color.
Read the case studyHonest fit
We'd rather tell you now than sell you the wrong engagement.
FAQ
With Core Web Vitals (LCP for loading, INP for responsiveness, CLS for layout shifts), bundle size per route and profiles of the interactions your users complain about. We record a baseline first and measure the same way after every change.
INP replaced FID as a Core Web Vital in March 2024. FID only measured the delay before the first interaction, while INP looks at responsiveness across the whole visit. Heavy reactive updates and large re-renders now show up in your scores.
Usually, yes. Most gains come from targeted changes: moving heavy components out of the first load, caching routes with Nitro route rules, fixing hydration mismatches and, on Vue 3.5 or later, hydrating async components lazily.
No. We can't promise a number before we've profiled your app. We promise to measure honestly, fix the biggest causes first and show you what changed.
A performance audit answers one question: why is it slow, and what fixes it. A code audit reviews the whole codebase, including structure, state, data flow and risk. If speed is a symptom of deeper problems, we'll tell you to start with the wider review.
A performance audit is available as a short engagement, scoped with you. Ongoing work runs on our monthly plans: $1,499 a month part-time or $2,499 full-time, with no minimum commitment.
Get started
Send us the URL or the screen that feels slow, the Vue or Nuxt version and what your users complain about. A senior engineer will reply with what we'd measure first.
Matched in 24 hours·48 hours free on every plan·No long-term contract